Drawing 3D charts and statistical maps
1. Drawing 3D charts using mplot3d
1.1 Mplot3d overview
1 | |

1 | |
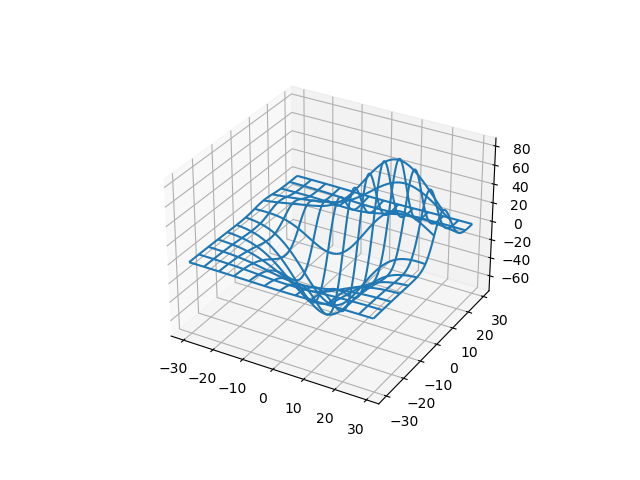
1.2 Draw common 3D charts
1 | |
1 | |

1.3 Demo1: Stars in three-dimensional space
1 | |

2. Using animation to make a dynamic diagram
2.1 Animation overview
1 | |

1 | |

2.2 Demo2: Twinkling stars in three-dimensional space
1 | |

3. Using basemap to draw statistical map
3.1 Basemap overview
3.2 Demo3: Population distribution of some cities and towns in the United States
1 | |

Attachment
Drawing 3D charts and statistical maps
https://www.hardyhu.cn/2022/03/27/Drawing-3D-charts-and-statistical-maps/